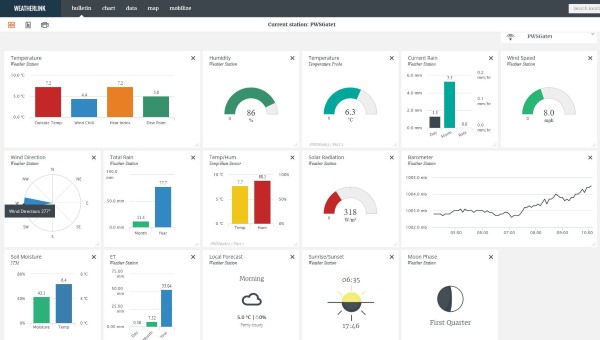
The web interface for EnviroMonitor provides comprehensive access to all readings and settings. It represents a major upgrade for how Davis presents data online and seems well designed to cater for the myriad combinations of gateways, nodes and sensors that an EM system could possess. As is customary for Davis, the web software retains the Weatherlink name, but is a completely new and modern incarnation of the Weatherlink platform.

The web interface should be viewable on any device with a standard web browser and is of course accessible from anywhere in the world with an Internet connection. (Users of devices with a small display area like smartphones might prefer to use the custom EM smartphone apps as an alternative.)
The main EnviroMonitor web page is essentially a dashboard that displays – in graphic form, by default – all of the enabled readings from sensors visible to the user’s primary Gateway, plus a set of menus that provide access to all the other features and settings. This current-readings area is called ‘Bulletin’ my analogy with traditional Weatherlink, but is redesigned out of all recognition with the previous version. The new Bulletin display is a tiled/graphic design that has considerable customisability.
The principal features include:
- Current readings in graphical or text format (including max/min data);
- A highly flexible Chart module;
- A new Mobilize module that provides recent readings AND forecast estimates for 3-4 days ahead of e.g. weather and soil parameters that may be critical to the success of certain crops, e.g. frost or weather or irrigation warnings;
- A spreadsheet-like view of any selected block of Data (cf Browse mode in ‘old’ Weatherlink);
- A world map of installed EM stations;
- Access to all of the account and configurational settings of the EM system, including various Alarm thresholds and Notification settings
Please contact us if you need more specific information on any aspects of the EM data handling.
